Chest CT
Chest CT read: nodules with Fleischner or Lung-RADS, PE with RV strain, lungs, pleura and ribs.
Chest16 sections
CT· volume
Biomarker panel from routine CT: sarcopenia, bone density, liver fat, aortic calcium, fractures.
This model is not available to run yet. Vote to show interest and get an email when it opens.
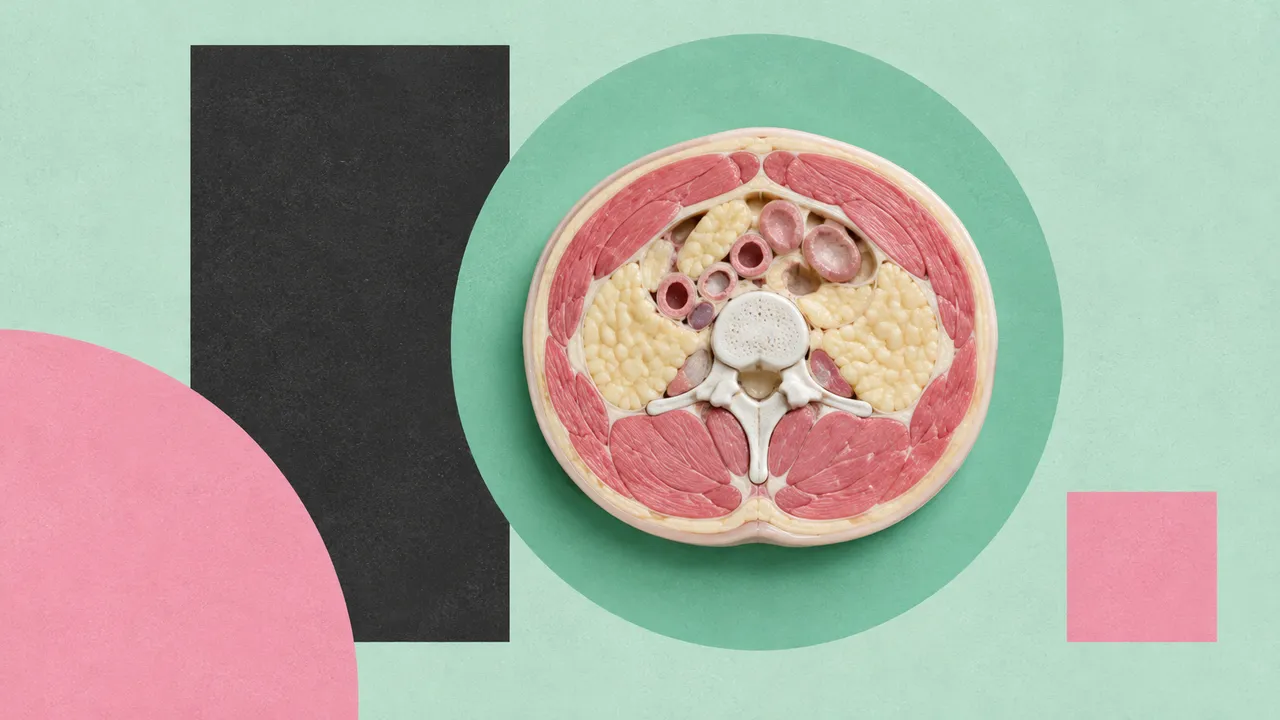
Opportunistic CT Biomarkers turns a chest or abdomen CT that was ordered for another reason into a screening panel, with no extra scan and no extra radiation. Upload the study as it was acquired; the run finds the vertebral levels, checks which of them the scan covers and measures what that coverage allows.
The panel has five parts: muscle and fat at the third lumbar vertebra, trabecular bone attenuation at the first lumbar vertebra, liver attenuation against the spleen, calcification of the thoracic and abdominal aorta, and osteoporotic compression fractures from T4 to L5. Each value comes with its reference range and a flag when it falls outside it, so a single page tells the clinician which follow-up test to consider. Aortic calcium is quantified without a reference threshold.
Population-health decision support: a routine CT gains a biomarker panel, and the general practitioner or internist decides whether a bone densitometry scan, a liver work-up, a nutrition review or a cardiovascular risk assessment is due.
General practitioners, internists, endocrinologists, geriatricians, hepatologists and oncologists following body composition, and radiology departments running opportunistic screening. Developers run the panel in the background on CTs already in the archive and feed the flags into a population-health or care-gap system.
| Requirement | Why |
|---|---|
| Coverage of L3, or of T12 to L5 | The sarcopenia cut-offs are defined at L3; neighbouring levels are measured when L3 is outside the scan |
| Coverage of L1 | Trabecular attenuation for bone density is read at L1, with T12 to L5 as fallback |
| Liver and spleen in the field of view | Steatosis is judged from both attenuations |
| Detected contrast phase and tube voltage (KVP) | Contrast and kVp change HU, so bone and liver values are phase-corrected |
| Sagittal reformat possible from thin slices | Vertebral height loss is measured on sagittal images |
A vertebra with a fracture or hardware is excluded from the bone-density measurement and the next level is used.
Sex goes in clinical_context: the sarcopenia cut-offs differ by sex. The indication of the original CT is kept with
the result.
One JSON panel with one section per biomarker, each with its value, threshold where one exists, flag and the vertebral level it was measured at.
| Section | Content |
|---|---|
| Body composition | Skeletal-muscle area and index, muscle attenuation (myosteatosis), visceral, subcutaneous and intermuscular fat, sarcopenia flag |
| Bone density | Trabecular attenuation at L1 (or T12–L5) with a BMD estimate and an osteoporosis or osteopenia flag |
| Liver fat | Liver and spleen attenuation and their difference, with a hepatic steatosis flag |
| Aortic calcium | Quantified calcification of the abdominal and thoracic aorta |
| Vertebral compression fractures | Fractured vertebrae from T4 to L5 with height loss and Genant grade 1–3 |
| Draft report | Opt-in (options.report): an English narrative that interprets the result for the reader (findings, impression, limitations); every number is checked against the findings |
Contrast phase and tube voltage change attenuation, so bone and liver values from enhanced scans are phase-corrected before they are compared with the thresholds. Calibration also differs between scanners, and the result records the series, phase and kVp behind every value.
One run returns every section its input supports.
Chest CT
Chest CT read: nodules with Fleischner or Lung-RADS, PE with RV strain, lungs, pleura and ribs.
Head CT
Head CT read: bleed volumes, ASPECTS, vessel occlusion, perfusion core and skull fractures.
Abdomen & Pelvis CT
Abdomen-pelvis CT read: acute abdomen flags, organ lesions with management, stones and trauma.
Cardiac CT
Cardiac CT read: Agatston calcium, CAD-RADS 2.0 stenosis, plaque, chambers and TAVI measurements.
Spine CT
Spine CT read: every vertebra labelled, fractures with AO Spine type, alignment and canal size.
CT Angiography (Aorta, Carotid, Run-off)
Arterial CTA read: aortic diameters, dissection and aneurysm, endoleak, carotid and leg stenoses.