Brain PET and DaT SPECT
Brain PET and DaT SPECT read: Centiloid, CenTauRz, FDG dementia patterns and striatal binding.
Neuro6 sections
NM· volume
Renal scintigraphy read: diuretic renogram curves, split function, drainage and DMSA cortical scars.
This model is not available to run yet. Vote to show interest and get an email when it opens.
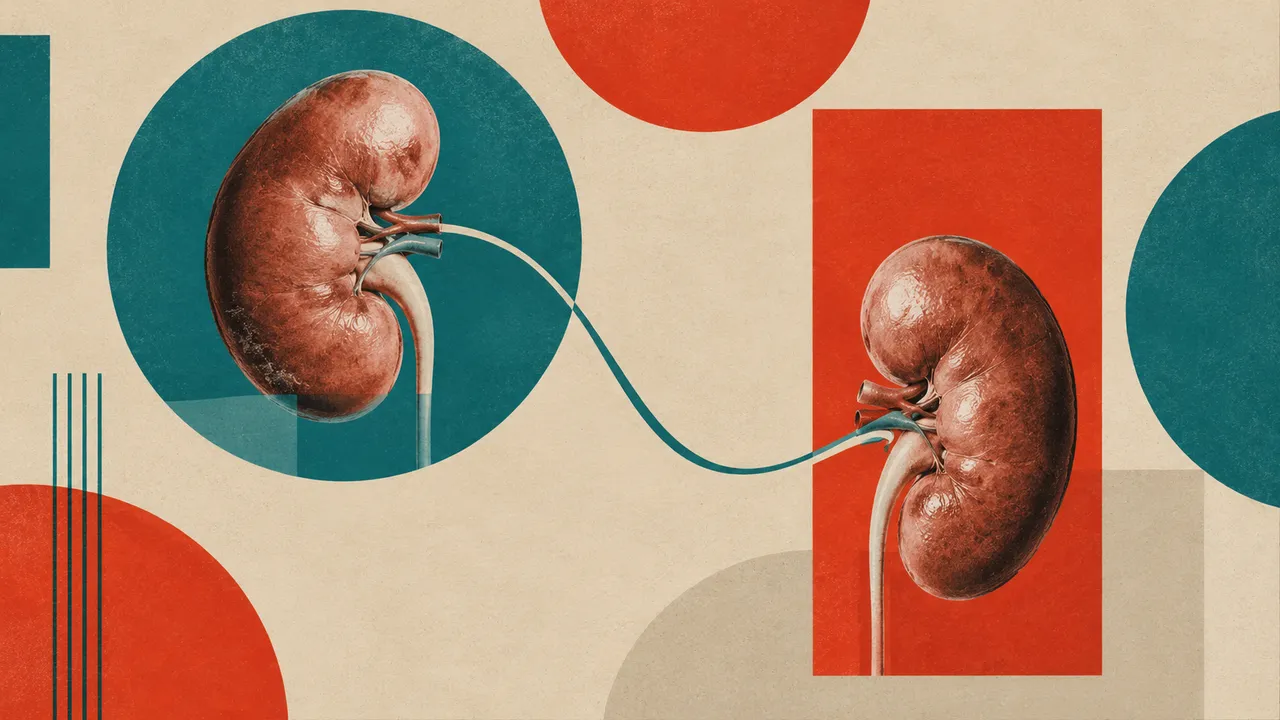
Renal Scintigraphy reads the two renal nuclear-medicine studies. Dynamic Tc-99m MAG3 or DTPA renography, usually with a diuretic, measures how each kidney takes up tracer and how well it drains in suspected urinary tract obstruction. Static Tc-99m DMSA imaging shows the functioning renal cortex and its scars, mainly in children after urinary tract infection.
For a renogram, the run draws kidney and background regions, builds the time-activity curves and returns split function, time to peak (Tmax), drainage half-time (T½) and output efficiency, with the drainage pattern behind the obstruction call. For a DMSA scan, it maps cortical defects and scars and gives the differential renal function.
Decision support for studies that are quantitative by nature but sensitive to how regions are drawn: a reproducible set of curves and numbers traced to their regions, and a consistent drainage assessment for the urologist deciding between observation and surgery. Poor hydration, a full bladder and a dilated, compliant collecting system can all slow drainage without obstruction, so the drainage pattern is returned with the curve behind it.
Nuclear-medicine physicians and radiologists reporting renal studies, paediatric urologists and nephrologists following hydronephrosis and urinary tract infection, and adult urologists assessing obstruction and planning surgery.
| Requirement | Why |
|---|---|
| Dynamic frames with frame timing from injection onward | Time-activity curves, Tmax and split function in the uptake window |
| Both kidneys and the bladder in the field of view | Regions for each kidney and assessment of drainage |
| Time of diuretic administration (renogram) | Drainage half-time is measured after the diuretic |
| Posterior or both posterior and anterior views (DMSA) | Differential function and cortical defects per kidney |
| Original DICOM NM images, not screenshots | Region-based counts need the source data |
Age, hydration, bladder catheterisation, the diuretic timing protocol and prior pyeloplasty or reimplantation can be
passed in clinical_context; they are used in the guidance.
| Section | Content |
|---|---|
| Diuretic renogram | Kidney regions, time-activity curves, split function, Tmax, drainage half-time, output efficiency and drainage pattern |
| DMSA cortical scan | Cortical defects and scars per kidney and differential renal function |
| Draft report | Opt-in (options.report): an English narrative that interprets the result for the reader (findings, impression, limitations); every number is checked against the findings |
The regions of interest and curves are returned with the numbers, so every value can be traced back to the counts it was computed from.
Split function is the share of total renal uptake contributed by each kidney in the early uptake phase. Tmax and the drainage half-time describe the curve shape; output efficiency expresses how much of the tracer taken up by the kidney has left it by a given time, which is less dependent on renal function than the half-time alone.
One run returns every section its input supports.
Brain PET and DaT SPECT
Brain PET and DaT SPECT read: Centiloid, CenTauRz, FDG dementia patterns and striatal binding.
FDG PET/CT (Oncology)
Oncologic FDG PET/CT read: lesions with SUV, Lugano stage, Deauville score and metabolic response.
Bone Scintigraphy
Whole-body bone scan read: metastatic hotspots, Bone Scan Index, PCWG3 progression and ATTR-CM flag.
Nuclear Cardiology (MPI and Cardiac Amyloid)
Nuclear cardiology read: perfusion scores, gated function, myocardial blood flow and ATTR-CM grade.
PSMA PET/CT
PSMA PET/CT read: PROMISE V2 miTNM staging, PSMA tumour volume and Lu-PSMA eligibility signals.
Lung V/Q Scintigraphy
Lung V/Q read: segmental mismatched perfusion defects and a pulmonary embolism call per EANM 2019.